
Five Years of City Alive Data - The Big Takeaways
By Aly Sanchez | Director of Projects, The Grant Plant | Jan. 24, 2019
As we work across all sectors to lift up homegrown entrepreneurs and small business owners, we have to stay accountable. At City Alive we have big goals: increase economic growth, inclusion and resilience. But how do we measure change at the city level? For the past five years we’ve rigorously tracked the data to ensure we’re making progress in the areas that matter most to local entrepreneurship and equity: job growth, unemployment, weekly wage and economic stability/mobility.
We’ve run the numbers and compiled the most important takeaways from five years of data. Here’s a look at how we’re doing as an economic ecosystem.
What Does Job Growth Look Like?
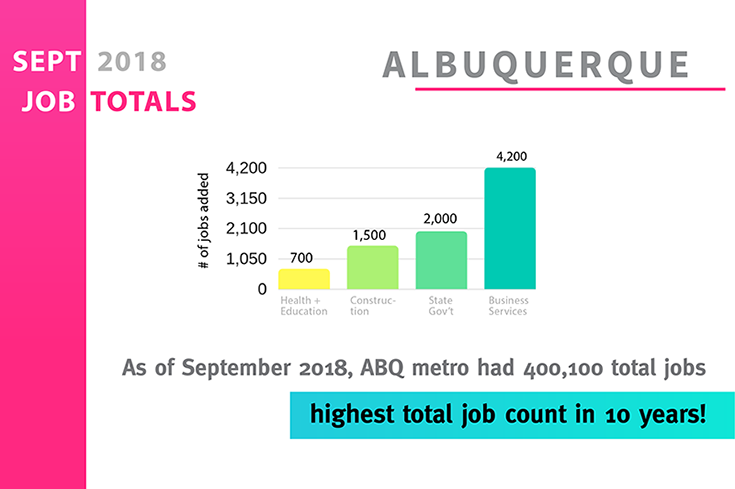
One sign of a growing city economy is the number of jobs and employees. The City Alive target for this measure was to reach employment of 410,000 in the metro area. This is an increase of 36,000 over the City Alive project baseline of 374,000 in March of 2014. The most recent figure, from November of 2018, shows we are well on our way with 404,100 non-farm employees. This is a 4.5 percent increase over the 2014 level. In fact, the last two months of available numbers are historic highs for Albuquerque.
The “3-6 Year” tab on the City Alive Performance Data dashboard shows job expansions and openings announcements in the metro area for the past 12 months. This is a great place to get an idea of major job growth sources.
Source: United States Department of Labor, Bureau of Labor Statistics. State and Area Employment, Hours, and Earnings. Total Nonfarm Employees (not seasonally adjusted). Albuquerque Metropolitan Statistical Area. November number is preliminary.
How Many People are Unemployed?
The number of people who would like to work but are not working provides a fuller picture of how well the city economy is supporting jobs. Tracking this data also helps balance out things that may inflate employment rates, like increases in employee numbers due to population growth and people getting counted more than once because they work at multiple companies. Our City Alive target was to have unemployment below 4.5 percent. The most recent figures show a 4.2 percent unemployment rate for the metro areas (November of 2018). This is compared to 6.3 percent at our baseline of March of 2014 and is significantly lower than the recession high of 10.3 percent unemployment in January of 2010. Given that the month of December typically has some of the lowest unemployment levels, due to holiday seasonal hiring, it looks like we will finish 2018 with eight months having been at or below the target level of 4.5 percent unemployment. A significant encouragement that we are headed in the right direction.
Source: United States Department of Labor, Bureau of Labor Statistic. Labor Force Statistics from the Current Population Survey. Unemployment Rate (not seasonally adjusted, 16 years or over). Albuquerque Metropolitan Statistical Area and United States. November number is preliminary. November number for Albuquerque MSA is preliminary.
How Much are People Earning?
A major emphasis in City Alive is developing an economy that is better able to support families and provide opportunities. This means that wages are just as important as job counts. In March of 2014, the average weekly wage in the metro area was $835, a level that was 81 percent of the national average at the time. We set a goal of reaching a weekly wage of $932. For the most recent quarter of reporting (Q2, 2018) the average weekly wage in Bernalillo County was $886, an increase of $47 a week or $2,444 per year. Notably, the two prior quarters were at $915 and $912.
We have been closing the gap versus the United States average wages, with increases more than double the national rates: 6.1 percent growth between Q2 2014 and Q2 2018 locally versus 2.8 percent growth nationally. As a result, the wages in Bernalillo County are now up to 84 percent of the national level. When looking at the wage rates in relation to inflation, it shows more needs to be done to consistently outpace rises in the costs of living. For 11 of the 17 quarters of data on wages since March of 2014, the wage growth has outpaced inflation but the most recent quarter did not keep apace as inflation has been increasing and wages dipped.
Source: United States Department of Labor, Bureau of Labor Statistic. Average Weekly Wage in Total Covered Total, all industries for All establishment sizes. Bernalillo County, New Mexico and United States. Quarter 1 and Quarter 2 of 2018 are preliminary for both county and national data sets.
Are Families Gaining their Economic Footing?
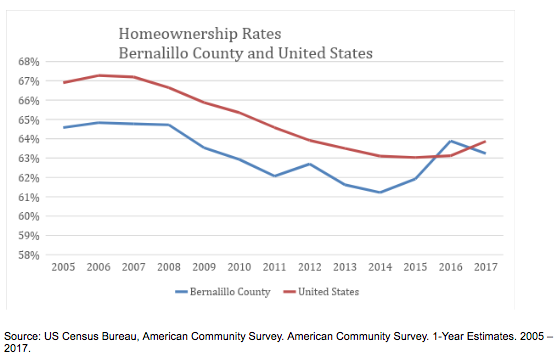
There are many ways to look for changes in household economic mobility and stability. The homeownership rate is one measure that captures aspects of asset building, capital access and steady income. It also gives us an idea of when—and if—rising employment and wages start to translate into longer term financial planning and activities. The move to home ownership typically means a family has cash savings, good credit and a trust in future income.
As shown in the chart below, the homeownership rates nationally and locally have not recovered to pre-recession levels with rates falling for several years before beginning to inch up in 2014. We have made significant headway, though, with Bernalillo County recovering to 2009 levels and closing a persistent gap in homeownership versus the United States levels.
How Many Businesses are Launching?
As Robin Brulé explored in her article Closing the Gaps in the New Year, City Alive’s hypothesis is that economic growth, inclusion and resilience comes from developing an ecosystem that supports entrepreneurship. Because of this, we track new business registrations with the City of Albuquerque. Since March of 2014, over 23,000 new businesses registered. Since January of 2008, there have been six months with new registrations topping 500 businesses. Five of those months have been since March of 2017.
Looking at annual data shows increased variation compared to prior years; for example, 2017 had the highest number of registrations in 10 years while 2016 had the lowest number in the prior 10 years. We don’t know all of the reasons for this but the swings are bigger since City Alive began so they likely reflect entrepreneurship initiatives capturing interest and motivating bursts of business launches. Keeping interest high over time by coordinating timing of work to engage different sectors, business types and demographic groups holds promise to sustain increases.
Source: City of Albuquerque, Planning Department. Business Registrations data. Active business listings first issued during the data month. January 2008 – December 2018.
Our progress as a city, as a collective impact initiative and as a body of collaborators and changemakers is encouraging, and indicative of a growing base of economic security for Albuquerque residents and families. Thanks to your support, enthusiasm and commitment we’ve made major strides toward deep, systemic change and a healthier, more inclusive economy. We’ve got more work to do. And we’ll be tracking it along the way. Here’s to another five years of tenacious, ambitious goal setting and action.
